eISSN: 2093-8462 http://jesk.or.kr
Open Access, Peer-reviewed
eISSN: 2093-8462 http://jesk.or.kr
Open Access, Peer-reviewed
Seung Kweon Hong
10.5143/JESK.2017.36.5.525 Epub 2017 November 01
Abstract
Objective: The aim of this study is to investigate maritime officers' strategies to avoid the ship collision in crossing situations.
Background: In a situation where there is a risk of collision between two ships, maritime officers can change the direction and speed of the own-ship to avoid the collision. They have four options to select; adjusting the speed only, the direction only, both the speed and direction at the same time and no action. Research questions were whether the strategy they are using differs according to the shipboard experience of maritime officers and the representation method of ARPA (automatic radar plotting aid) - radar graphic information.
Method: Participants were 12. Six of them had more than 3 years of onboard experience, while the others were 4th grade students at Korea Maritime and Ocean University. For each participant, 32 ship encounter situations were provided with ARPA-radar information. 16 situations were presented by the north-up display and 16 situations were presented by the track-up display. Participants were asked to decide how to move the own-ship to avoid the ship collision for each case.
Results: Most participants attempted to avoid the collision by adjusting the direction of the ship, representing an average of 22.4 times in 32 judgment trials (about 70%). Participants who did not have experience on board were more likely to control speed and direction at the same time than participants with onboard experience. Participants with onboard experience were more likely to control the direction of the ship only. On the other hand, although the same ARPA Information was provided to the participants, the participants in many cases made different judgments depending on the method of information representation; track-up display and north-up display. It was only 25% that the participants made the same judgment under the same collision situations. Participants with onboard experience did make the same judgment more than participants with no onboard experience.
Conclusion: In marine collision situations, maritime officers tend to avoid collisions by adjusting only the direction of their ships, and this tendency is more pronounced among maritime officers with onboard experience. The effect of the method of information representation on their judgment was not significant.
Application: The results of this research might help to train maritime officers for safe navigation and to design a collision avoidance support system.
Keywords
Collision avoidance North-up display Decision making Experience Maritime officer
Collisions between ships in ship accidents occupy a very high rate (Geum et al., 2003). Most ship collision accidents are also reported to be caused by human error (Grech et al., 2002). The related human errors include observational errors on the movement of the target ship, underestimation of collision risk, and misinterpretation of regulations for collision avoidance. Human errors related to ship collision can be said to be errors in situational awareness and decision making process. In order to understand the causes of the ship collision more seriously and to prevent the ship collision, it is important to understand the maritime officers' situation awareness and the decision-making process in the collision situation (Chauvin et al., 2008).
If a target ship is approaching our ship's course, it is common for the maritime officer either to decide the course of our ship by communicating with the target ship or to decide the course of our ship in accordance with regulations for collision avoidance. The purpose of this study is to investigate the strategy used by maritime officers to avoid collision in situations where a ship is approaching toward our ship course and where they cannot well communicate with the ship. This situation is a situation where cognitive demand of maritime officers is very high (Hockey et al., 2003).
There have been very few studies on how maritime officers make decisions for collision avoidance. The Hong (2015) study examined the factors that influence the decisions of the maritime officers in various situations. This study reanalyzes data collected from Hong (2015) as a follow - up study of Hong (2015). Thus, the participants and participants' tasks and the stimuli provided to the participants were the same. For the sake of the reader's understanding, these parts are described in more detail in this paper. However, the analysis method was different.
In this paper, the strategy that maritime officers can choose is one of four options. They can adjust the speed only, the direction only and the speed and direction at the same time. If they believe that the current situation is not a risk of collision, they will not take any action. Maritime officers are surveyed to see which strategy they are using. In addition, it is investigated how the usage rates of the strategies differs according to the shipboard experience of maritime officers and the representation method of ARPA (automatic radar plotting aid) - radar graphic information.
2.1 Participants
The total number of participants was 12. Six participants (6 men) had experience of ship handling on board over three years. Six participants (2 men, 4 women) were in fourth grade at Korea maritime and Ocean University. The students had knowledge of the ship's operation and had experience of ship handling in a simulated environment.
2.2 Tasks and stimulus
In ship crossing situations where there is a risk of collision or near miss, participants were asked to decide how to control their ships. Participants had to change the speed or direction of their ships to avoid ship collisions.
All participants were provided with ARPA-radar information, representing 32 ship crossing situations. The risk level of these conditions was 0.13NM on average (Max=0.31NM, Min=0.01NM), expressed as DCPA (Closest point of approach) and TCPA (Time to the closest point of approach) was 0.22 hour on average (Max=0.64 hour, Min=0.06 hour). DCPA indicates the shortest distance when two ships approach, and the time until this point is TCPA. Typically, DCPA is represented as CPA on the ARPA radar. The situation information provided to the participants was eight kinds of ARPA-radar information, including the speed and direction of own-ship, the speed and direction of the target ship, target distance, target bearing, DCPA (CPA) and TCPA.
As shown in Figure 1, the provided ARPA-radar graphic information was of two types; north-up display and track-up display. The north-up display is a display method in which the top of the radar always indicates the north, regardless of the direction of the own-ship, while the track-up display is a display method in which the traveling direction of the own-ship always points to the top of the radar.
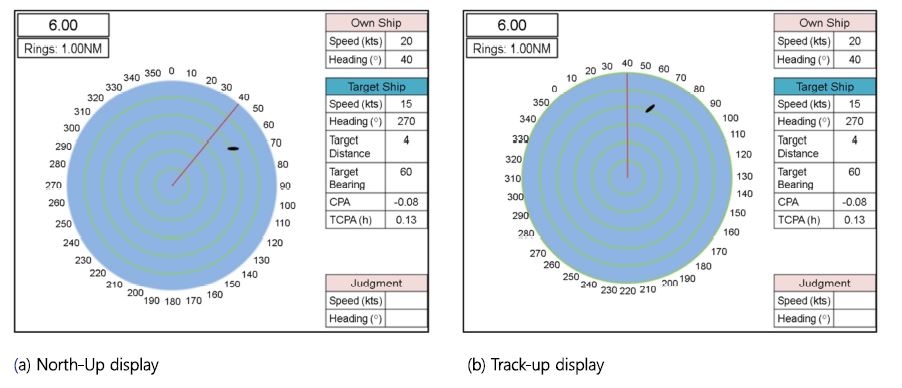
Of the 32 ship crossing situations, 16 were shown as north-up displays and 16 as track-up displays. In order to measure the effect of the graphic display, eight kinds of ARPA-radar information displayed on the north-up display were also displayed on the track-up display with the same data. In other words, the same crossing situations were presented to the participants twice, indicating that crossing situations provided to the participants were only 16 situations.
2.3 Data analysis method
Independent variable and dependent variables in this experiment was set up as shown Table 1. The data collected in this experiment is what participants determined the speed and direction of ownership in order to avoid a given risky situation.
|
Independent variables |
Dependent variables |
|
Experience on board (2
Levels) |
Judgments (Speed
and Heading) |
|
ARPA radar display (2
Levels) |
|
First, the collected data were classified into the four strategies described above. The ratio of each strategy by each participant was calculated. Using these ratios, it was used to test the hypothesis that "the ratios of collision avoidance strategies used by participants were used at an even rate". In addition, it was verified whether the ratio of the four strategies differed according to experience on board (Section 3.1 and Section 3.3). On the other hand, participants' judgments were converted into DCPA when the ship proceeded at the speed and direction judged by the participants. DCPA values were evaluated for differences depending on the strategy used (Section 3.2 and Section 3.4).
3.1 Strategies to avoid ship collisions
Participants can adjust the direction or speed of their ship to avoid collisions. That is, participants selected one of four strategies that could be used to avoid collisions. Among the 32 collision avoidance trials performed by each participant, the frequency of use of each strategy was analyzed. Most of the participants tried to avoid the collision by adjusting the ship's direction only. They tended to avoid the collision by adjusting direction only with an average of 22.4 times in 32 judgment trials (about 70%). Only one participant avoided the collisions by adjusting 100% direction without using any other strategy.
The avoidance of collision using the speed only occurred in 5 participants, with an average of 3.9% of the judgments they performed. No collision avoidance behaviors were found in 5 participants, and the average of the judgment was 3.1%. The control of the speed and direction at the same time were measured in 6 participants and the average was 23.1%.
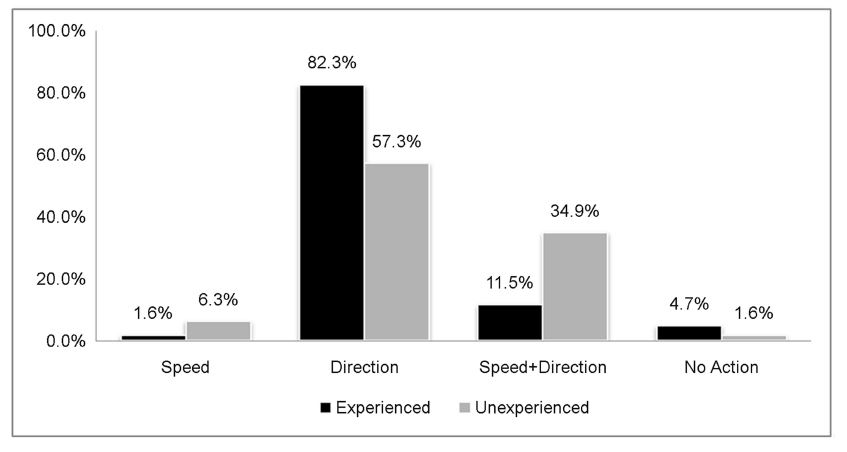
The percentage of each strategy used by each participant was calculated. Two-way ANOVA was conducted to analyze whether these ratios were different depending on the shipboard experience and the type of strategy as shown in Table 2. Figure 2 shows the ratio of each strategy usage according to the presence or absence of onboard experience. Participants who did not have experience on board were more likely to control speed and direction at the same time than participants with onboard experience, while participants with onboard experience were more likely to control the direction of the ship only.
|
DF |
SS |
MS |
F |
p |
|
|
Experience on board |
1 |
0.00 |
0.00 |
0.00 |
1.00 |
|
Strategy |
3 |
3.52 |
1.17 |
29.79 |
0.00** |
|
Interaction |
3 |
0.36 |
0.12 |
3.06 |
0.04** |
|
Error |
40 |
1.58 |
0.04 |
||
|
Total |
47 |
5.46 |
3.2 Effects of the used strategy on the DCPA
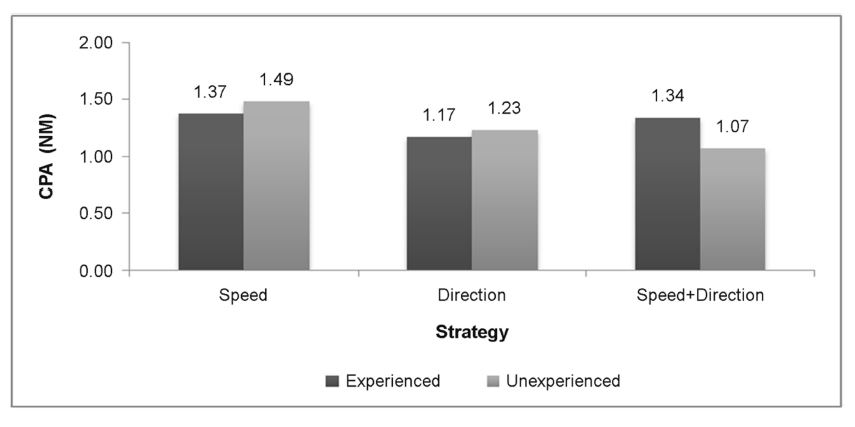
It was analyzed how the DCPA differs according to the strategy (except for no action) used by the participants. As shown in Figure 3, there was no significant difference in the DCPA according to the strategy used (F(2, 364) = 1.14, p = 0.320) and the presence or absence of the shipboard experience (F(1, 364) = 0.04, p = 0.833).
3.3 Effects of north-up and track-up display on the collision avoidance strategy
If there is no influence of the radar's graphical display method on the strategy that participants use to avoid collisions, participants will make the same judgment in the same situation regardless of the graphical display method of the radar. The participants made the same judgments of 3.92 trials (25%) of the 16 pair of trials that the same situations were presented. It may be said that it is influenced greatly by the display method, indicating that 75% was dependent on the graphical representation.
T-test was conducted to determine whether the number of same judgments was different according to the onboard experience. There was no statistically significant difference (t(9) = 0.79, p = 0.448), but participants with onboard experience was likely to judge the same judgments more than participants with no experience; 4.5 times (28%) and 3.3 times (21%).
When there was a difference in judgment according to the graphical representation method, it was investigated whether there was a difference only in the speed, a difference only in the direction, or a difference in the both speed and the direction. Figure 4 shows the results of this investigation. the number of trials in which there were differences in speed only, differences in direction only, or differences in speed and direction.
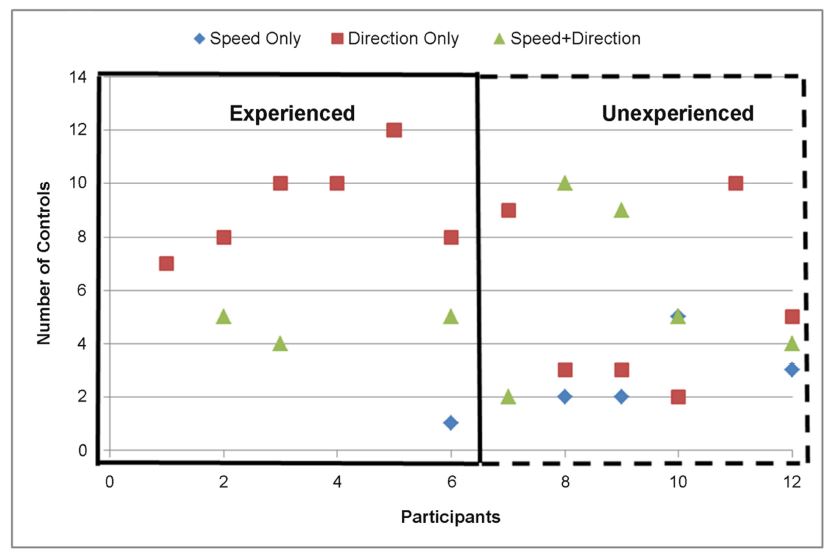
The participants with shipboard experience made different judgments by changing the direction of the ship only, while the unexperienced made different judgments by changing only by the speed, or both the speed and direction at the same time.
3.4 Effects of north-up and track-up display on DCPA
When participants make judgments about speed and direction of the ship, whether this judgment is appropriate is dependent on whether the risk of ship collision is reduced. Therefore, participants would have thought that their judgments on the speed and direction can induce the DCPA enough to avoid ship collision. It was analyzed how the speed and direction judged differently according to the display method are reflected in the DCPA. There were no significant effects on the DCPAs according to the display method and shipboard experience; (F(1,20) = 0.53, p = 0.477) for the shipboard experience, F(1,20) = 0.09, p = 0.763) for the display methods).
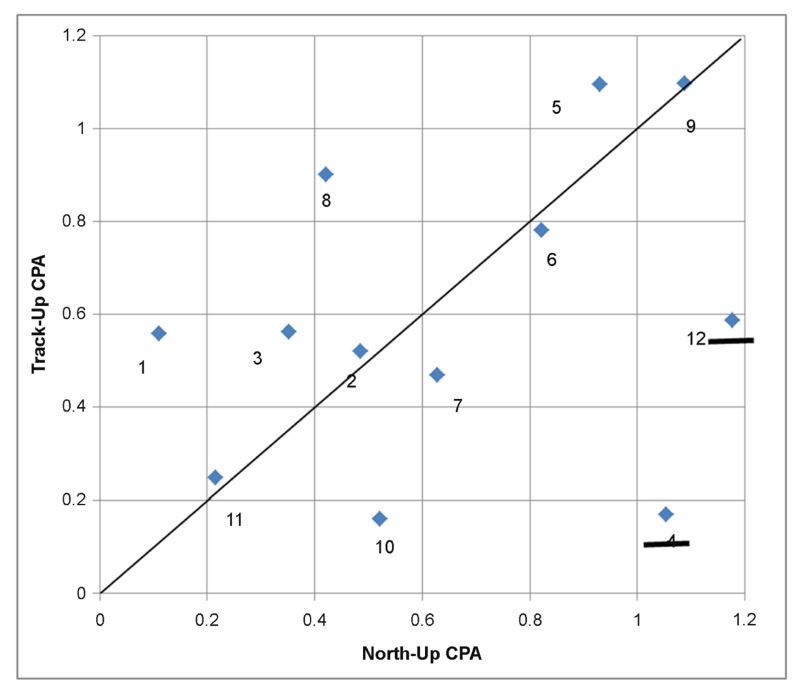
In addition, an analysis was performed to determine whether the DPAs of each participant were different according to the display method. The result of the one-way ANOVA showed different DCPAs according to individual participants (F(11, 12) = 2.66, p = 0.05). Figure 6 shows a graph of the DCPAs determined by the individual participants, using the track-up display and the north-up display. It indicates if the data approach the diagonal line of Figure 5, although the judgments on the speed and direction are different due to the difference of display, the DCPAs are similar.
The Pearson correlation coefficient was 0.313 (p = 0.322). However, except for 12 and 4 participants, the Pearson correlation coefficient increases to 0.674 (p = 0.03). Participants 1 through 6 were participants with onboard experience and participants 7 through 12 were participants without onboard experience. Thus, the two exceptional participants were one in the experienced group and one in the unexperienced group. In conclusion, participants generally had similar judgment accuracy regardless of the track-up display and the north-up display.
In a situation where there is a risk of collision between two ships, maritime officers can change the direction and speed of the own-ship to avoid the collision. Their strategy can be classified into four types of strategy; adjusting the speed only, the direction only, both the speed and direction at the same time and no action. Most participants attempted to avoid the collision by adjusting the direction only, representing an average of 22.4 times in 32 judgment trials (about 70%). Participants with onboard experience were more likely to control the direction only than participants with not onboard experience.
These results are important implications in terms of education and training. The only adjustment of direction to avoid collisions may be recommended for students taking ship navigation training. However, unfortunately there was no significant difference between the DCPAs obtained by the judgments of participants with shipboard experience and the DCPAs of the participants with on shipboard experience.
Also, preferentially steering directions for collision avoidance will be useful knowledge for the design of the anti-collision support system. If the speed and direction of the ship is adjusted for collision avoidance at the same time, there are too many maneuvering ways to choose from (Van Dam et al., 2008). It would be pointless for the anti-collision support system to suggest all these maneuvering ways. It may therefore be desirable to adjust the direction of the ship, if possible, to avoid the risk of collision of the ship, and to avoid collision by adjusting the speed of the ship when this is not possible.
In this study, there was no difference in maritime officers' collision avoidance strategy when using the north-up display and the track-up display. We expected that the track-up display to be more effective than north-up display. Several researchers have investigated whether navigational map readers perform a mental rotation when the map orientation and direction of travel are not aligned (Shepard and Hurwitz 1984; Aretz and Wickens 1992). The results of these studies indicated that mental rotation was required in reading such a navigational map, influencing reading speed and accuracy. This influence was especially profound with more complex map. The different result from our expectation in this study may be because the graphic display of ARPA-radar is not as complex as the other navigational maps, so the burden of metal rotation is less.
The results of Hong (2015) showed that participants were less likely to avoid collision by changing ship speed only. Participants with onboard experience showed this tendency more prominently. It was a two strategy-based analysis in order to investigate whether participants were using speed alone to avoid collisions or the other strategy. In this study, however, data were analyzed based on four strategies of maritime officers for collision avoidance. Results of reanalysis were that most of the participants tended to control only the direction of the ship and that this tendency was more prominent to the participants with onboard experience.
In this study, in-depth analysis of the effect of ARPA-radar display on collision avoidance judgment was also performed. The ARPA-radar display method did not affect the DCPAs regardless of the participants' experience on board. However, even though the ARPA-radar display was different, participants with onboard experience tended to use the same strategy.
This study investigated the influence of ARPA-radar graphic display and shipboard experience on maritime officers' strategy for collision avoidance. However, in addition to the two factors addressed in this study, their strategy may change due to various other factors. Research on the other factors should continue in the future.
References
1. Aretz, A.J. and Wickens, C., The mental rotation of map displays, Human Performance, 5(4), 303-328, 1992.
Crossref
Google Scholar
2. Chauvin, C., Clostermann, J.P. and Jean-Michel Hoc, J.M., Situation awareness and the decision-making process in a dynamic situation: Avoiding collisions at sea. Journal of Cognitive Engineering and Decision Making, 2(1), 1-23, 2008.
Crossref
Google Scholar
3. Geum, J.S., Yang, W.J. and Jang, W.J., A study on the system dynamics analysis for human factors in ship's collision accidents, Journal of Korean Navigation and Port Research, 27(5), 493-498, 2003.
Crossref
Google Scholar
4. Grech, M.R., Horberry, T. and Smith, A., Human error in maritime operations: Analysis of accident reports using the Leximancer tool. Proceedings of the Human Factors and Ergonomics Society Annual Meeting: University of Queensland, Brisbane, 46(19), 1718-1721, 2002.
Crossref
Google Scholar
5. Hockey, G.R.J., Healey, A., Crawshaw, M., Wastell, D.G. and Sauer, J., Cognitive demands of collision avoidance in simulated ship control. Human Factors, 45, 252-265, 2003.
Crossref
Google Scholar
6. Hong, S.K., Analysis of factors influencing ship collision avoidance judgment of maritime officers, Journal of the Korean Institute of Plant Engineering, 20(1), March, 3-10, 2015.
Crossref
7. Shepard, R. and Hurwitz, S., Upward direction, mental rotation, and the discrimination of left and right turns in maps. Cognition, 18, 161-169, 1984.
Crossref
Google Scholar
8. Van Dam, S.B.J., Mulder, M. and van Paassen, M.M., Ecological interface design of tactical airborne separation assistance tool, IEEE Transactions on Systems, Man and Cybernetics - Part A: Systems and Humans, 38(6), 1221-1233, 2008.
Crossref
Google Scholar
PIDS App ServiceClick here!