eISSN: 2093-8462 http://jesk.or.kr
Open Access, Peer-reviewed
eISSN: 2093-8462 http://jesk.or.kr
Open Access, Peer-reviewed
Jong Hyun Kim
, Chang Gi Lee
, Kwang Bok Kim
, Su Bin Kim
10.5143/JESK.2025.44.6.821 Epub 2026 January 02
Abstract
Objective: This study aimed to conduct a usability evaluation of a rehabilitation service application for older adults and, based on the results, propose practical guidelines to improve application design. Specifically, the study sought to verify whether design improvements in content, graphics, layout, and interaction could enhance efficiency and user satisfaction.
Background: With the rapid growth of the aging population, rising healthcare costs, and reduced accessibility to medical services, interest in mobile health (mHealth) has significantly increased. Although various guidelines for designing applications for older adults have been proposed, few studies have empirically validated their effectiveness through experimental usability evaluations.
Method: A total of 36 older adults (mean age = 64.91, SD = 2.74) participated in experiments at the Senior Industry Innovation Center Living Lab. Participants were randomly assigned to use either the existing application (EA) or the improved application (IA), which incorporated seven guideline-based design improvements such as unified terminology, enlarged control buttons, optimized layout spacing, logical menu ordering, and audio/visual assistance. Three main tasks—rehabilitation exercise, gait assessment, and knee range of motion measurement—were evaluated. Usability was assessed through performance metrics (absolute/relative performance time, click count, error count) and the System Usability Scale (SUS).
Results: The IA demonstrated marked improvements compared to the EA. Relative performance times decreased by 59% (Task 1), 37% (Task 2), and 4% (Task 3). Relative click counts decreased by 88%, 92%, and 36% across the three tasks, while error counts dropped by 88%, 89%, and 50%, respectively. SUS scores also improved by 9% (Task 1), 13% (Task 2), and 10% (Task 3). Although absolute performance times and click counts increased in some cases due to additional preparation and help processes, these changes ultimately contributed to error reduction and improved user comprehension.
Conclusion & Application: The findings confirm that usability guidelines tailored for older adults can significantly improve the efficiency and satisfaction of mHealth applications. Particularly, unifying terminology, enlarging interface elements, and integrating supportive explanations were shown to reduce errors and enhance user confidence. This study provides empirical evidence supporting the application of design guidelines in developing mHealth services for older adults and offers practical insights for creating safer, more accessible, and user-friendly digital healthcare solutions.
Keywords
Usability evaluation Design guideline for older adults User interface for older adults Mobile healthcare applications Digital healthcare for older adults
Older adults aged 65 and above are expected to comprise 10% of the global population in 2022, with a projected increase to 16% by 2050 (United Nations, 2022). This demographic shift is accompanied by a demand for healthy aging and a rise in healthcare costs. Older adults in low-income brackets often face difficulties in accessing and sustaining medical services (Doetsch et al., 2017; Murata et al., 2010). To alleviate the rise in healthcare costs, alternatives such as health management, prevention, telemedicine, and mobile health (mHealth) are emerging (Ainsworth et al., 2013; Bali, 2018; Bricker et al., 2014; Ignatowicz et al., 2019; Ramsey et al., 2020; Torous and Powell, 2015; WHO, 2021).
mHealth is primarily utilized on smartphones and is defined as "medical and public health practice supported by mobile devices" (WHO, 2011). The global mHealth application market is rapidly expanding, offering services such as fitness, disease management, telemedicine, medication management, and personal health record management (Grand View Research, 2023). Among these, the monitoring services sector holds the highest revenue share in the 2022 mHealth market at 61.5% (Grand View Research, 2023).
The smartphone adoption rate among individuals aged 65 years and above, who constitute a significant portion of patients with chronic diseases, is substantial, with rates of 67% in the United Kingdom and 61% in the United States (Statista, 2021; Statista, 2022). Although the number of digital healthcare applications has increased to 350,000, barriers to entry persist for mHealth (IQVIA, 2021). While younger users find application usage more intuitive, older adults encounter difficulties in intuitive comprehension during initial use. Older people tend to hesitate to use mobile devices due to a fear of lack of knowledge (Cajita et al., 2018). They face challenges in utilizing smartphones due to physical functional decline such as visual, auditory, and memory issues (Davis et al., 2007; Farage et al., 2012). (Scheibe et al., 2015) revealed that diabetes patients aged 50 or older found discomfort in data input, menu navigation, and small font sizes when using the diabetes management applications Glucose Monitor and OnTrack Diabetes.
In a study by Ruzic (Ruzic et al., 2016), guidelines for fonts, layout, and images for older adults were proposed, but their effectiveness remains unverified as no actual evaluations using them were conducted. Lindberg (Lindberg and De Troyer, 2021) created a web application and conducted expert Likert scale evaluations for each item in the guidelines, identifying essential elements to be considered in the application. However, quantitative comparative analyses of a specific figure, such as font size and spacing width, were not conducted. While research is being conducted on application design guidelines for older adults, there is a significant lack of research experimenting with their effectiveness, despite consideration for various problems (Chung and Kang, 2020; Gomez-Hernandez et al., 2023). Furthermore, the evaluation methods for mHealth applications for older adults mainly rely on subjective surveys or interviews, with objective data collection methods being less commonly utilized (Wang et al., 2022).
This study aimed to improve mHealth applications for older adults based on existing guidelines and identify effective design elements by analyzing the effects of improvement using a usability evaluation. We conducted a quantitative comparative evaluation of the existing rehabilitation service application based on gait assessment (RSAGA) and its improved version with the applied guidelines for content, graphics, layout, and interaction using the System Usability Scale (SUS) and performance metrics (Albert and Tullis, 2022). The SUS is easy to use even for older adults, and reliable can be obtained even with small sample sizes. If the guidelines for designing customized applications for older adults are applied to the development of mHealth applications, performance time, the click count, and the error count will decrease and the SUS score will improve compared to that of the early version of the application.
The remainder of this paper is organized as follows. Section 2 identifies problems with existing mHealth applications for older adults and suggests improvements according to the guidelines. Moreover, this section presents an experimental process and data analysis method to quantitatively analyze the improvement effect. Section 3 presents the experimental results. Finally, the discussion and conclusions are presented in Sections 4 and 5, respectively.
2.1 Participants and setting
The experiment took place at the Living Lab of the Senior Industry Innovation Center in Seongnam, South Korea in December 2022. To evaluate the usability of the improved application (IA), a usability assessment was conducted with participants aged 60 and above.
Participants were recruited through the Korea Institute of Industrial Technology and drawn from the pool of participants of the Seongnam Senior Industrial Innovation Center, a research institute specializing in usability evaluation for older adults. The appropriate number of participants was determined following Albert (Albert and Tullis, 2022). Thirty-six participants were recruited in accordance; therefore, data from 10 or more individuals were necessary to ensure statistical significance for tests utilizing performance metrics. Similarly, tests employing the formative usability test revealed that significant performance indicators could be obtained through the use of personal data from 8 to 12 individuals.
To enhance the reliability of the usability evaluation, 20 men and 16 women were recruited from a healthy elderly population without knee impairment. The inclusion criteria were as follows: not lacking in physical ability and knee health, able to walk independently, and no history of mental illness such as dementia. Participants were from 60 to 70 years of age, with a mean age of 64.91 (SD=2.74). Participants were randomly divided into groups of 18 people, and each group used a different application. To ensure balanced participant characteristics, smartphone proficiency was self-assessed and categorized into three levels—high, medium, and low—based on subjective evaluation. Group allocation was adjusted to maintain comparable proficiency levels between the EA and IA groups. Although no significant differences related to smartphone proficiency were found in the results, this factor was considered during randomization. Additionally, each group consisted of 10 males and 8 females to ensure gender balance.
This study obtained approval for the experimental procedures from Korea Institute of Industrial Technology the Institutional Review Board. Participants were provided with a description of the study and completed a consent form prior to participating in the study, and were assured that their information would remain confidential.
2.2 Design improvement
RSAGA mainly functions to provide post-surgery monitoring services. Users can check their recovery status after TKR surgery through knee angle measurement and walking pattern analysis before and after surgery, step counting, pain level assessment, and self- medical examination. The application also provides videos of rehabilitation exercises necessary after discharge.
Usability issues related to content, graphics, layout, and interaction were identified within the service after confirming the guidelines presented in previous studies (Barros et al., 2014; de Almeida et al., 2015; Harte et al., 2017; Jo and Lee, 2018; Kascak et al., 2014; Morey et al., 2019; Silva et al., 2014). Guidelines were formulated by integrating user interface evaluation guidelines and heuristic evaluation lists, considering the characteristics of older adults described in previous studies. Table 1 shows the problems of the existing application (EA) that do not follow improvement factors in design presented in previous studies. Table 2 summarizes the seven items applied to the IA. Among the design improvement elements listed in Table 2, alphabetic indicators were added to denote which elements were applied to the figure.
|
Menu |
Problem |
|
Main page |
The step counting menu, which is automatically measured, is
positioned at the top |
|
Rehabilitation exercise |
The term "essential exercise" may cause confusion, as it is not consistent with the |
|
Limited spacing between the video image and
the exercise name. |
|
|
When completing one set, the corresponding exercise moves to the
bottom, even though the recommendation is for a total of three sets. |
|
|
The small button size makes it difficult to
click. |
|
|
It is not possible to skip the explanation
during repetitive exercises. |
|
|
Gait assessment and measuring |
Use of inconsistent terminology may lead to
confusion. |
|
No indication of whether the measurement
task has been conducted in the current state. |
|
|
No guidance regarding the wearing of the
equipment. |
|
Application design items |
Design improvement factors |
|
Content |
a Unification
of terminology |
|
b Provides
help for understanding |
|
|
Graphics |
c Zoom
in on control button size |
|
Layout |
d Free
up enough space |
|
e Categorized
by priority into key and additional information |
|
|
Interaction |
f Displaying
the screen, providing information through sound |
|
g Place
in logical order |
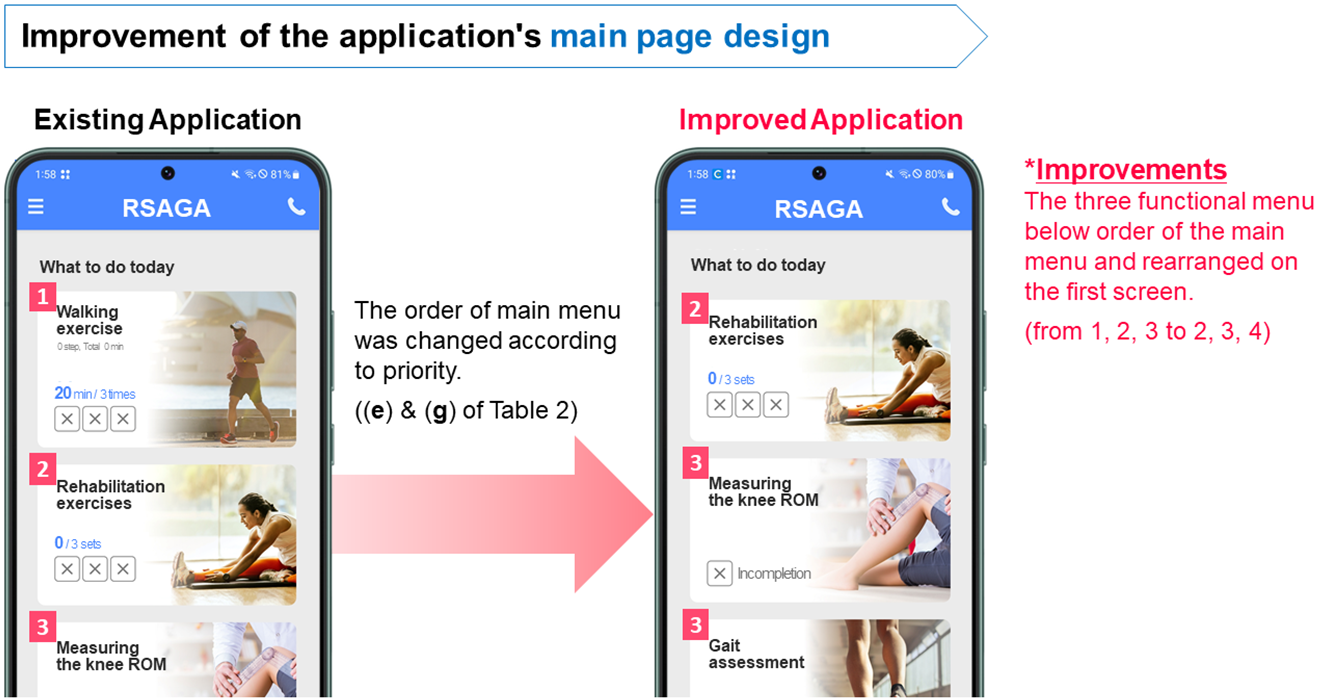
The design improvement factors between the EA and IA are as follows. The main screen was rearranged in terms of layout and interaction, considering the importance of elements and the sequence of application use (Jo and Lee, 2018). It was divided into two parts: (1) functions requiring measurement and action (rehabilitation exercises, measuring the knee range of motion (ROM), and gait assessment) and (2) functions requiring simple checks and enabling automatic measurements (assessing pain levels, self-medical examination, and step counting). In the main menu, the less important item was moved down. The changes from 1, 2, 3, 4, 5, 6 to 2, 3, 4, 5, 6, 1 can be seen in Figure 1. As the overall layout remained unchanged, Figure 1 selectively illustrates the portion where the menu order was modified, highlighting the movement of item 1 to the last position (Figure 1).
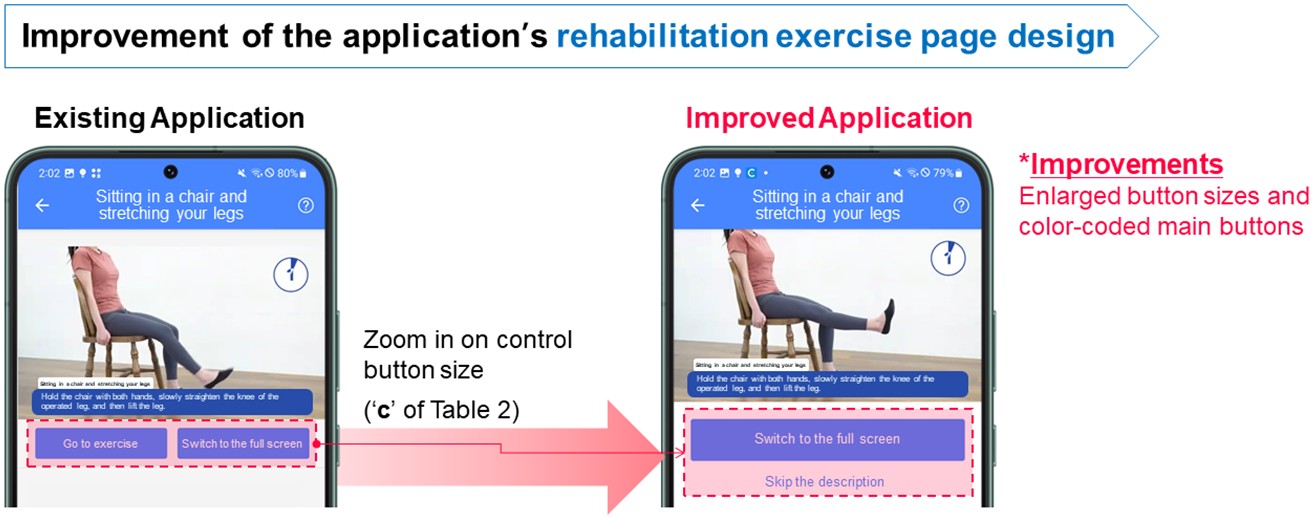
In rehabilitation exercises, the main heading was changed from "essential exercises" to "rehabilitation exercises," the button size was increased, and the space between images and text was expanded (de Almeida et al., 2015; Harte et al., 2017). The screens for rehabilitation exercises before and after improvement can be observed in Figure 2.
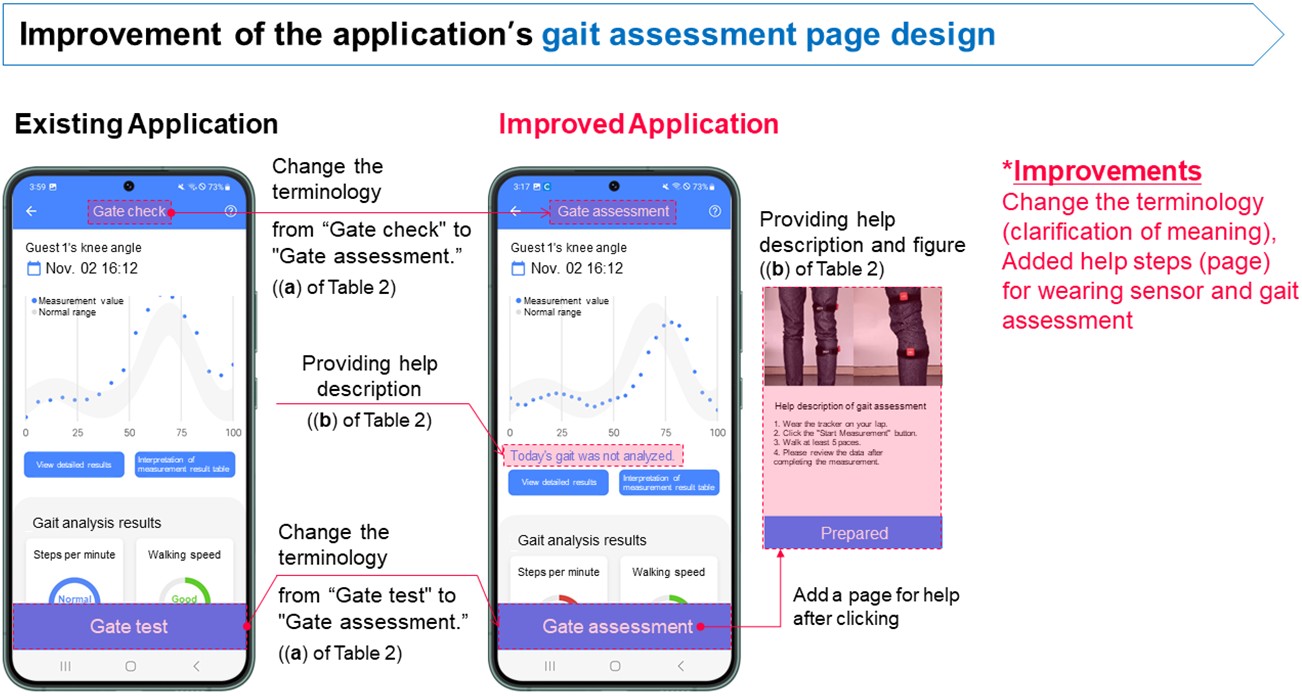
In gait assessment, the title was changed from "gait check" to "gait assessment," and in measuring the knee ROM, the term was changed from "daily joint angle measurement" to "measuring the knee ROM." Additionally, in both gait assessment and measuring the knee ROM, assistance was added to indicate today's measurement status and help with measurement preparation (Barros et al., 2014; Morey et al., 2019). Furthermore, a sound notification was introduced during the 3-second waiting period before starting to walk (Kascak et al., 2014; Silva et al., 2014). The improvements of before and after can be seen in Figure 3.
2.3 Measurement
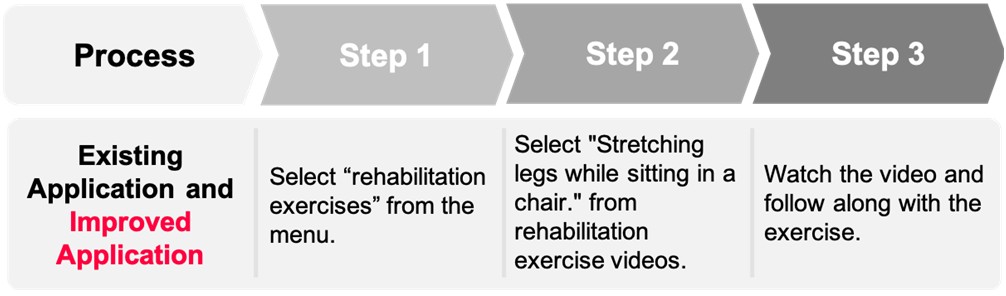
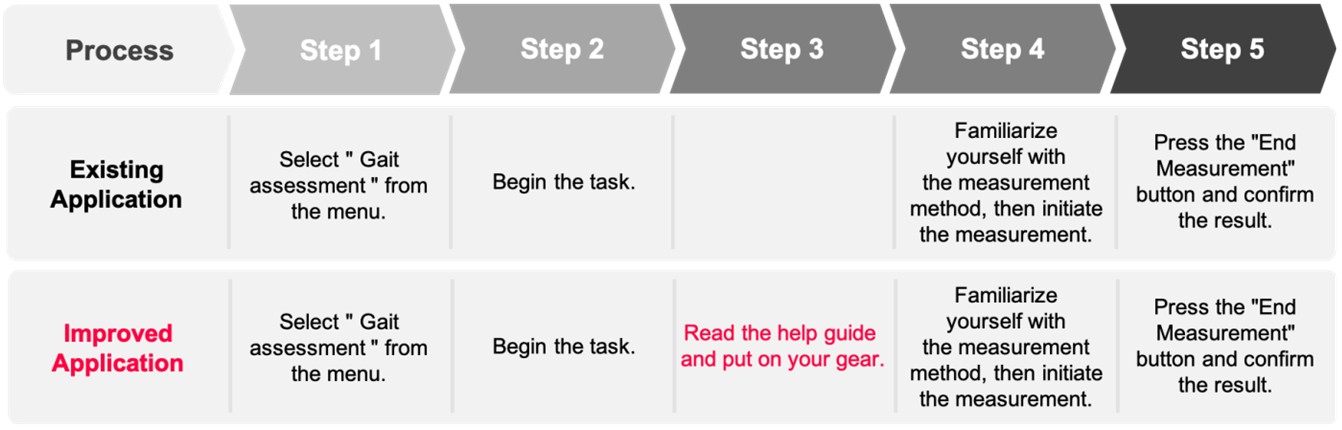
The experiment began with an introduction to the simple procedural steps and guidance on precautions. Participants were asked to perform tasks based on three of the application's functions (Task 1: rehabilitation exercise, Task 2: gait assessment, Task 3: measuring the knee ROM) without assistance. Each task was then performed once more after a detailed explanation. Thereafter, SUS was evaluated.
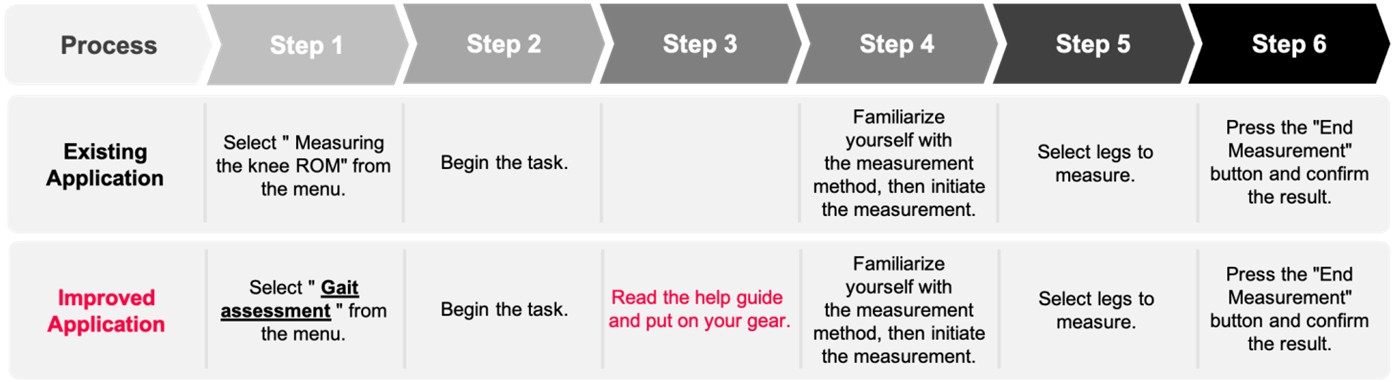
After completing Task 1 and before starting Task 2, participants received assistance in wearing the tracker. One step in each task is defined as the period between the initiation or transition of screens and pressing the next button. The flow of each task can be verified in Figures 4-6. In Figure 6, the term "Gait check" was revised to "Gait assessment," and this textual modification is visually emphasized with an underline to help readers recognize the difference between the EA and IA process flows.
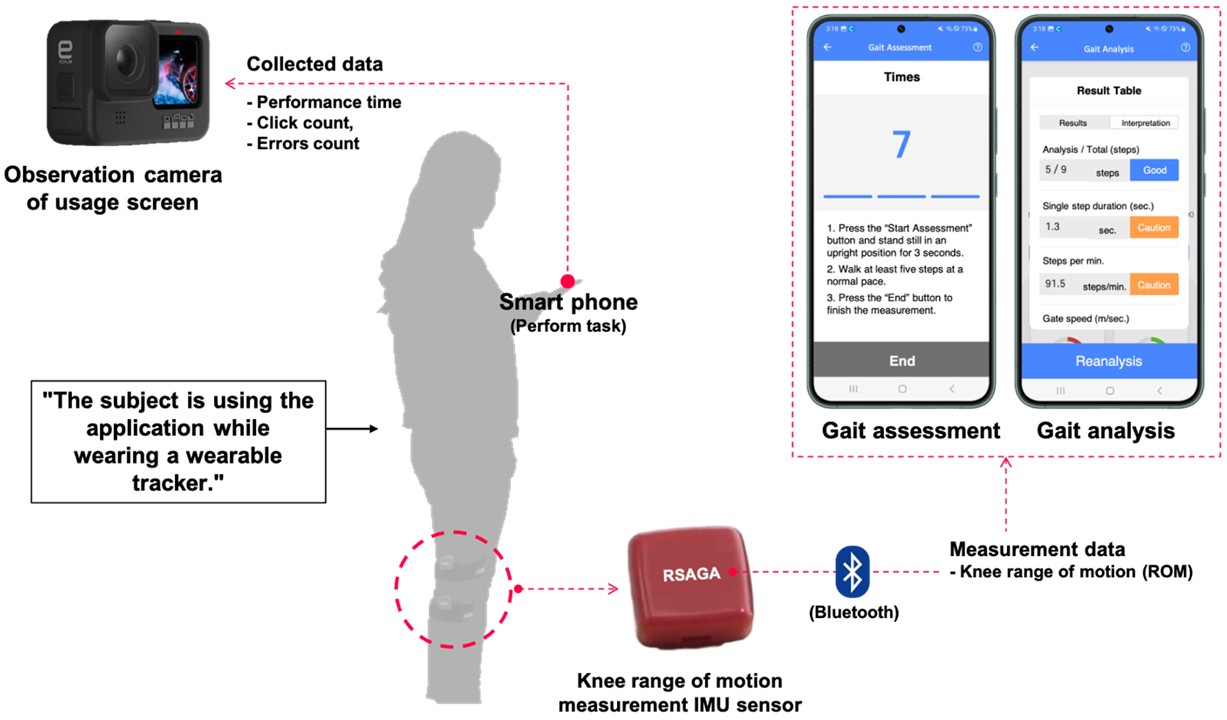
The wearable tracker and application visually display recovery status and progress. The wearable tracker's accelerometers and gyro sensors were used to measure knee angles and walking patterns. These data were then transmitted to a mobile application installed on a smart phone via Bluetooth. Participants' use of the application was recorded using the observation camera (Figure 7).
2.4 Analysis
To assess the usability of the service in comparison to the improved version, performance metrics were analyzed by watching experiment footage captured on video. These performance metrics were used to assess efficiency through the following parameters: time taken to perform tasks, click count made to complete tasks, and occurrence of errors during the application usage process. To provide a relative comparison, performance time (Equation (1)) and click count (Equation (2)) were measured against the minimum time and clicks required by skilled experts to perform the task. The same task was performed twice, and usability was measured using the SUS questionnaire.
Relative performance time = {(Participan's time - Expert time)/ Expert time}*100 (1)
Relative click count = {(Participant's clicks - Expert clicks)/ Expert clicks}*100 (2)
Efficiency was analyzed using an independent t-test. With one independent variable, improvement status (ImSt), influencing five dependent variables (absolute performance time, relative performance time, absolute click count, relative click count, error count), an independent t-test was conducted to determine if there were significant differences in the averages of Task 1, 2, and 3 (p < 0.05).
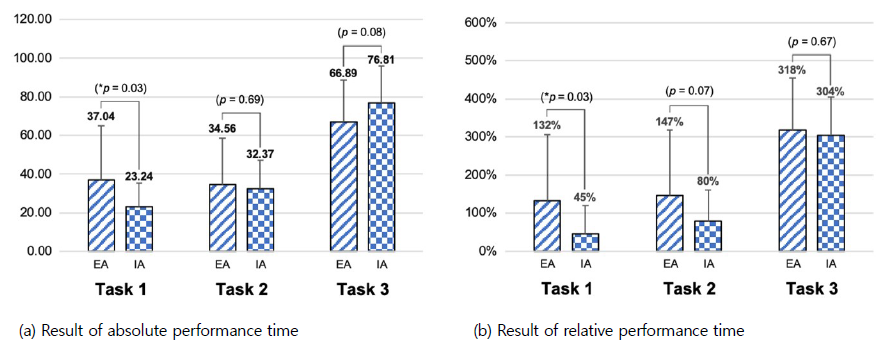
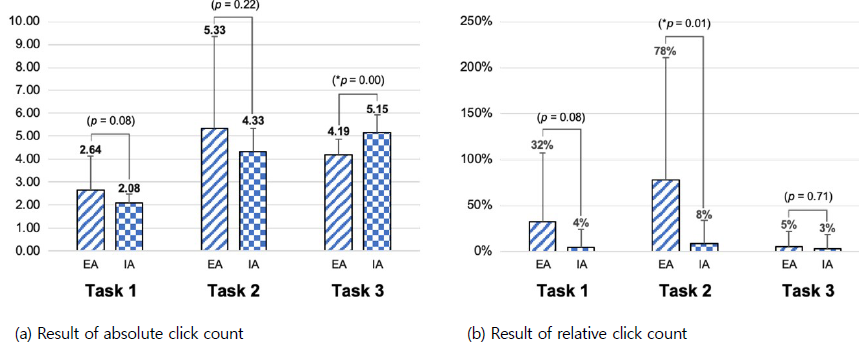
Figures 8-10 summarize the results for each task and user satisfaction based on SUS scores. There was a 34% reduction in absolute performance time after improvement in Task 1 (Figure 8(a)). Compared to expert performance times, a decrease of 59%, 37%, and 4% in relative performance time was observed in Tasks 1, 2 and 3, respectively, after improvement (Figure 8(b)).
A 21% and 35% reduction in the absolute click count was observed in Tasks 1 and 2, respectively, after improvement (Figure 9(a)). Regarding relative click count compared to expert click counts, there was an 88%, 92%, and 36% decrease in Tasks 1, 2 and 3, respectively, post-improvement (Figure 9(b)).
The error count decreased by 88%, 89%, and 50% for Tasks 1, 2, and 3, respectively, after improvement (Figure 10(a)). Regarding SUS scores, a 9%, 13%, and 10% increase was observed for Tasks 1, 2, and 3, respectively, post-improvement (Figure 10(b)).
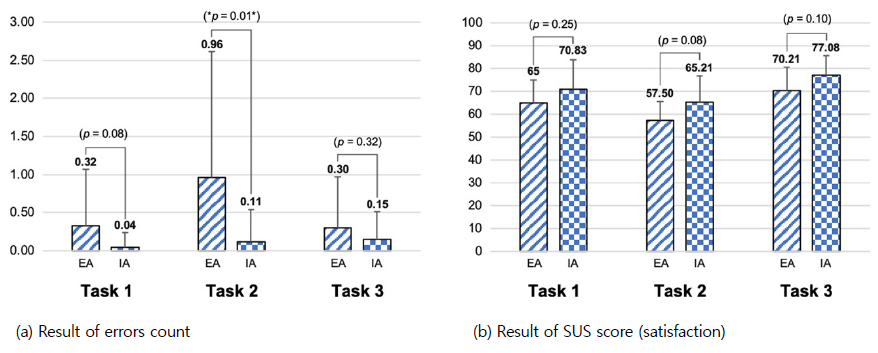
According to the independent t-test results, a significant mean difference between pre- and post-improvement was observed in the absolute and relative performance times for Task 1, the relative click and error counts for Task 2 and the absolute click count for Task 3. There was no significant mean difference in SUS score between pre- and post-improvement for all tasks.
Older adults lack an intuitive understanding of applications they encounter for the first time, making it difficult for them to use an application without a detailed explanation of unified terminology and preparations. This study identified which design improvement factors positively influence application usability. We found that terminology unification and help provision have a positive effect on the reduction of the error count and the SUS.
While previous studies have developed guidelines for the heuristic evaluation of existing applications, it is difficult to determine whether these guidelines are valid. We thus conducted an experiment divided into the pre- and post-improvement stages to confirm the influence of the factors to which the guidelines were applied. For Task 1, rehabilitation exercises, standardizing terminology, adjusting layout spacing for enhanced readability, and enlarging button sizes for users (de Almeida et al., 2015; Harte et al., 2017) led to a reduction in performance time, click count, and error count. The usability of an mHealth application can help older adults more easily master rehabilitation exercises. Mastering these exercises may motivate them to adhere to rehabilitation routines, ultimately contributing to improved overall health and well-being, as well as increased confidence and independence.
For Task 2, gait assessment, application improvements included standardizing terminology, providing sufficient explanations through help, and adding sound alerts (Barros et al., 2014; Morey et al., 2019). Processes were added; however, performance time, click count, and error count decreased. Specifically, relative item results significantly decreased due to cognitive support provided to users during execution.
For Task 3, measuring the knee ROM, improvements were made by standardizing terminology and providing additional help (Kascak et al., 2014; Silva et al., 2014). Relative results and error count decreased. However, absolute performance time and click count increased due to additional processes with help. The experimental results indicate that providing additional help enhances user understanding of the tasks, leading to a reduction in relative performance time and click count. This is interpreted as a means to minimize mistakes, consequently increasing SUS scores.
The positive results of Tasks 2 and 3 related to measurement not only benefit individual users, but also have broader implications for the quality of life of older adults and the professionals and caregivers who support them in their health journey. For instance, medical professionals can monitor patient progress more efficiently and coordinate medical services based on accurate data through the health application.
The study's limitation is that the data analysis did not consider the smartphone proficiency of participants. Participants were divided into EA and IA groups, and could not be evenly distributed based on individual smartphone proficiency. Through observations and surveys during the experiment, it was found that the EA group scored 2.7 points while the IA group scored 2.9 points on a 5-point scale, indicating an approximately 7% difference in smartphone proficiency.
This study conducted a comprehensive usability evaluation of a rehabilitation service application for older adults and applied guideline-based improvements across four dimensions—content, graphics, layout, and interaction. Through comparative experiments between the existing application (EA) and the improved application (IA), we verified that design modifications tailored to the needs of older adults can significantly enhance application usability. Quantitative analysis using performance metrics and SUS demonstrated substantial reductions in relative performance time, click count, and error occurrence, thereby validating the practical effectiveness of the proposed guidelines.
The findings underscore the importance of user-centered design in mHealth applications for older adults, particularly in reducing barriers to technology adoption. Improvements such as unified terminology, enlarged buttons, optimized information layout, and supportive explanations not only reduced operational errors but also increased user satisfaction and confidence. These outcomes highlight the role of design guidelines as essential tools for bridging the gap between application functionality and accessibility for older populations.
Beyond the immediate usability improvements, this study contributes broader implications for healthcare practice. Enhanced usability of rehabilitation service applications can promote adherence to exercise routines, support self-monitoring of recovery, and reduce dependence on clinical resources, thereby contributing to cost-effective healthcare delivery. Furthermore, the empirical validation of guidelines provides a foundation for developing standardized frameworks in mHealth application design for older adults.
Although this study was conducted in a controlled laboratory environment, it did not fully account for environmental and physical constraints that older adults may face during real-world mHealth use. Factors such as lighting, background noise, and device-handling difficulties may influence usability outcomes. Future studies should consider these contextual variables to enhance ecological validity and ensure practical applicability.
Future research should extend these findings by conducting longitudinal studies to assess how usability needs evolve as individuals age, as well as evaluating applications in real-world clinical and community contexts. Integration with wearable devices, telemedicine services, and AI-driven personalization could further enhance the effectiveness of mHealth solutions. Ultimately, this research offers a validated pathway for designing accessible and reliable mobile healthcare applications that can support healthy aging and improve quality of life for older adults.
References
1. Ainsworth, J., Palmier-Claus, J.E., Machin, M., Barrowclough, C., Dunn, G., Rogers, A., Buchan, I., Barkus, E., Kapur, S., Wykes, T., Hopkins, R.S. and Lewis, S., A comparison of two delivery modalities of a mobile phone-based assessment for serious mental illness: Native smartphone application vs text-messaging only implementations, Journal of Medical Internet Research, 15(4), e2328, 2013.
Google Scholar
2. Albert, B. and Tullis, T., Measuring the user experience: Collecting, analyzing, and presenting UX metrics. 3rd edn. Burlington, MK: Morgan Kaufmann, 71-106, 2022.
Google Scholar
3. Bali, S., Barriers to development of telemedicine in developing countries, in Heston, T.F. (ed.) Telehealth. London: IntechOpen, 2018.
Google Scholar
4. Barros, A.C. de, Leitão, R. and Ribeiro, J., Design and evaluation of a mobile user interface for older adults: Navigation, interaction and visual design recommendations, Procedia Computer Science, 27, 369-378, 2014.
Google Scholar
5. Bricker, J.B., Mull, K.E., Kientz, J.A., Vilardaga, R., Mercer, L.D., Akioka, K.J. and Heffner, J.L., Randomized, controlled pilot trial of a smartphone app for smoking cessation using acceptance and commitment therapy, Drug and Alcohol Dependence, 143, 87-94, 2014.
Google Scholar
6. Cajita, M.I., Hodgson, N.A., Lam, K.W., Yoo, S. and Han, H.R., Facilitators of and barriers to mHealth adoption in older adults with heart failure, Computers, Informatics, Nursing, 36, 376-382, 2018.
Google Scholar
7. Chung, K. and Kang, Y., Deriving design guidelines to address complexity issues in ecommerce apps for the elderly, Archives of Design Research, 33, 137-157, 2020.
Google Scholar
8. Davis, A., Smith, P., Ferguson, M. and Stephens, D., Acceptability, benefit and costs of early screening for hearing disability: A study of potential screening tests and models, Health Technology Assessment, 11, 1-294, 2007.
9. de Almeida, R.X.E., Ferreira, S.B.L. and Soares, H.P., Recommendations for the development of web interfaces on tablets/ipads with emphasis on elderly users, Procedia Computer Science, 67, 140-149, 2015.
Google Scholar
10. Doetsch, J., Pilot, E., Santana, P. and Krafft, T., Potential barriers in healthcare access of the elderly population influenced by the economic crisis and the Troika Agreement: A qualitative case study in Lisbon, Portugal, International Journal for Equity in Health, 16, 184, 2017.
Google Scholar
11. Farage, M.A., Miller, K.W., Ajayi, F. and Hutchins, D., Design principles to accommodate older adults, Global Journal of Health Science, 4, 2-25, 2012.
Google Scholar
12. Gomez-Hernandez, M., Ferre, X., Moral, C. and Villalba-Mora, E., Design guidelines of mobile apps for older adults: Systematic review and thematic analysis, JMIR mHealth and uHealth, 11, e43186, 2023.
Google Scholar
13. Grand View Research, mHealth Apps Market Size, Share & Trends Analysis Report By Type (Medical Apps, Fitness Apps), By Platform (Android, iOS), By Region (Asia Pacific, Middle East & Africa), And Segment Forecasts, 2025-2030, https:// www.grandviewresearch.com/industry-analysis/mhealth-app-market (retrieved September 18, 2025).
14. Grand View Research, mHealth Market Size, Share & Trends Analysis Report By Component (Wearables & Connected Wearable Devices, mHealth Apps, Services), By End-use, By Region, And Segment Forecasts, 2024-2030, https://www.grandviewresearch.com/ industry-analysis/mhealth-market (retrieved September 18, 2025).
15. Harte, R., Quinlan, L.R., Glynn, L., Rodríguez-Molinero, A., Baker, P.M., Scharf, T. and ÓLaighin, G., Human-centered design study: Enhancing the usability of a mobile phone app in an integrated falls risk detection system for use by older adult users, JMIR mHealth and uHealth, 5, e7046, 2017.
Google Scholar
16. Ignatowicz, A., Atherton, H., Bernstein, C.J., Bryce, C., Court, R., Sturt, J. and Griffiths, F., Internet videoconferencing for patient–clinician consultations in long-term conditions: A review of reviews and applications in line with guidelines and recommendations, Digital Health, 5, 2055207619845831, 2019.
Google Scholar
17. IQVIA, Digital Health Trends 2021, https://www.iqvia.com/insights/the-iqvia-institute/reports-and-publications/reports/digital-health-trends-2021 (retrieved September 18, 2025).
18. Jo, S.B. and Lee, J.I., Proposal of GUI guidelines to improve the usability of mobile healthcare for new silver generation, Smart Media Journal, 7, 60-70, 2018.
19. Kascak, L.R., Rébola, C.B. and Sanford, J.A., Integrating universal design (UD) principles and mobile design guidelines to improve design of mobile health applications for older adults, 2014 IEEE International Conference on Healthcare Informatics. IEEE, 343-348, 2014.
Google Scholar
20. Lindberg, R.S.N. and De Troyer, O., Towards an up to date list of design guidelines for elderly users', in CHI Greece 2021: 1st International Conference of the ACM Greek SIGCHI Chapter. New York: ACM, 1-7, 2021.
Google Scholar
21. Morey, S.A., Stuck, R.E., Chong, A.W., Barg-Walkow, L.H., Mitzner, T.L. and Rogers, W.A., Mobile health apps: Improving usability for older adult users, Ergonomics in Design, 27, 4-13, 2019.
Google Scholar
22. Murata, C., Yamada, T., Chen, C.C., Ojima, T., Hirai, H. and Kondo, K., Barriers to health care among the elderly in Japan', International Journal of Environmental Research and Public Health, 7, 1330-1341, 2010.
Google Scholar
23. Ramsey, W.A., Heidelberg, R.E., Gilbert, A.M., Heneghan, M.B., Badawy, S.M. and Alberts, N.M., eHealth and mHealth interventions in pediatric cancer: A systematic review of interventions across the cancer continuum, Psycho-Oncology, 29, 17-37, 2020.
Google Scholar
24. Ruzic, L., Lee, S.T., Liu, Y.E. and Sanford, J.A., Development of universal design mobile interface guidelines (UDMIG) for aging population', in Antona, M. and Stephanidis, C. (eds.) Universal Access in Human-Computer Interaction. Methods, Techniques, and Best Practices. Cham: Springer, 98-108, 2016.
Google Scholar
25. Scheibe, M., Reichelt, J., Bellmann, M. and Kirch, W., Acceptance factors of mobile apps for diabetes by patients aged 50 or older: A qualitative study', Medicine 2.0, 4, e1, 2015.
Google Scholar
26. Silva, P.A., Holden, K. and Nii, A., Smartphones, smart seniors, but not-so-smart apps: A heuristic evaluation of fitness apps, in Schmorrow, D.D. and Fidopiastis, C.M. (eds.) Foundations of augmented cognition. Advancing human performance and decision-making through adaptive systems. Cham: Springer, 347-358, 2014.
Google Scholar
27. Statista, Smartphone ownership in the U.S. 2015-2023, by age group, https://www.statista.com/statistics/489255/percentage-of-us-smartphone-owners-by-age-group/ (Accessed: 6 December 2023). (retrieved September 18, 2025).
28. Statista, Smartphone usage by age 2012-2022, https://www.statista.com/statistics/300402/smartphone-usage-in-the-uk-by-age/ (retrieved September 18, 2025).
29. Torous, J. and Powell, A.C., Current research and trends in the use of smartphone applications for mood disorders, Internet Interventions, 2, 169-173, 2015.
Google Scholar
30. United Nations, Department of Economic and Social Affairs, Population Division (2022) World Population Prospects 2022: Summary of Results, https://www.un.org/development/desa/pd/content/World-Population-Prospects-2022 (retrieved September 18, 2025).
31. Wang, Q., Liu, J., Zhou, L., Tian, J., Chen, X., Zhang, W., Wang, H., Zhou, W. and Gao, Y., Usability evaluation of mHealth apps for elderly individuals: A scoping review, BMC Medical Informatics and Decision Making, 22, 317, 2022.
Google Scholar
32. World Health Organization, WHO's Work on the UN Decade of Healthy Ageing (2021-2030), https://www.who.int/initiatives/ decade-of-healthy-ageing (retrieved September 18, 2025).
33. World Health Organization, Regional Office for Africa, mHealth: New horizons for health through mobile technologies, https://www.afro.who.int/publications/mhealth-new-horizons-health-through-mobile-technologie (retrieved September 18, 2025).
PIDS App ServiceClick here!